
Most RSI strategies fail because traders use the indicator without understanding market context. They see RSI above 70 and instantly sell, or RSI below 30 and immediately buy. The problem is that momentum indicators do not work the same way in every market condition. In strong trends, RSI can remain overbought or oversold far longer than most traders expect.
The discrepancy between expectation and reality is what trips a lot of inexperienced traders up. The consequences are costly, to say the least. Instead of analysing structure, trend strength, and volume, many traders rely on RSI alone to make decisions.
Traders using platforms like Insipix often discover that RSI becomes much more effective when combined with broader market analysis instead of being treated like a standalone signal generator.
The solution is not abandoning RSI completely. RSI still provides valuable momentum data, but interpreting it correctly is what makes it useful.
What RSI Actually Measures
The Relative Strength Index measures the speed and strength of recent price movement. It compares bullish and bearish momentum over a selected period, usually 14 candles by default.
RSI produces a value between 0 and 100. Readings above 70 typically signal strong bullish momentum, while readings below 30 often indicate strong bearish momentum. These levels shouldn’t immediately be interpreted as predictions for price reversal.
An overbought RSI doesn’t mean the market will reverse lower. Neither does an oversold RSI foretell a bullish reversal. These levels simply reflect momentum intensity rather than certainty. Keep this in mind, and you’ll avoid the biggest RSI mistake.
The Biggest RSI Misconception
The most common RSI mistake is assuming overbought and oversold levels predict reversals automatically. A common newbie mistake is believing RSI above 70 means “sell” while RSI below 30 means “buy.” Markets rarely behave that cleanly.
During strong trends, momentum can remain extreme for extended periods. Price may continue climbing while RSI stays overbought for days. In bearish conditions, RSI can remain deeply oversold while sellers continue pushing the market lower.
This creates repeated losses for traders fighting momentum too early. There’s a proclivity for retail traders to use RSI emotionally instead of analytically. When they see overbought conditions, they panic and assume the move is overextended without considering broader market conditions.
Experienced traders usually evaluate several factors before reacting to RSI readings:
- Trend direction, market structure, and higher timeframe momentum
- Volume behaviour, liquidity conditions, and price reactions near key levels
RSI provides incomplete information when looked at in isolation. Traders analysing momentum setups through Insipix or similar platforms often combine RSI with trend confirmation and price structure instead of reacting blindly to indicator readings.
Why Traders Keep Falling Into the Same Trap
Most people use RSI emotionally instead of analytically.
When they see overbought conditions, they panic and assume the move is overextended. They rush into reversal trades without considering:
- Trend direction
- Market structure
- Volume
- Liquidity
- Higher timeframe momentum
This creates poor entries and unnecessary losses.
Experienced traders understand that RSI alone provides incomplete information. Traders analysing momentum setups through Insipix or similar platforms often combine RSI with trend confirmation and price structure instead of reacting blindly to indicator readings.
RSI Behaves Differently in Trends
One of the most important lessons traders learn is that RSI changes behaviour depending on market conditions. Trending markets and range-bound markets produce completely different RSI signals.
In bullish markets, RSI often stays above 50 while pullbacks frequently stop near the 40 to 50 region. Overbought readings may persist for long periods because buying pressure remains dominant. Traders who short every overbought reading during strong uptrends usually end up trapped against momentum.
Bearish markets create the opposite effect. RSI struggles to rise above 60, oversold conditions appear repeatedly, and bearish momentum remains dominant. Buying simply because RSI reaches 30 becomes dangerous because oversold does not mean “cheap.” It often means sellers remain firmly in control.
Why RSI Works Better in Sideways Markets
RSI is more reliable during ranging conditions because price naturally moves between support and resistance. Oversold and overbought levels start carrying meaning in this market situation.
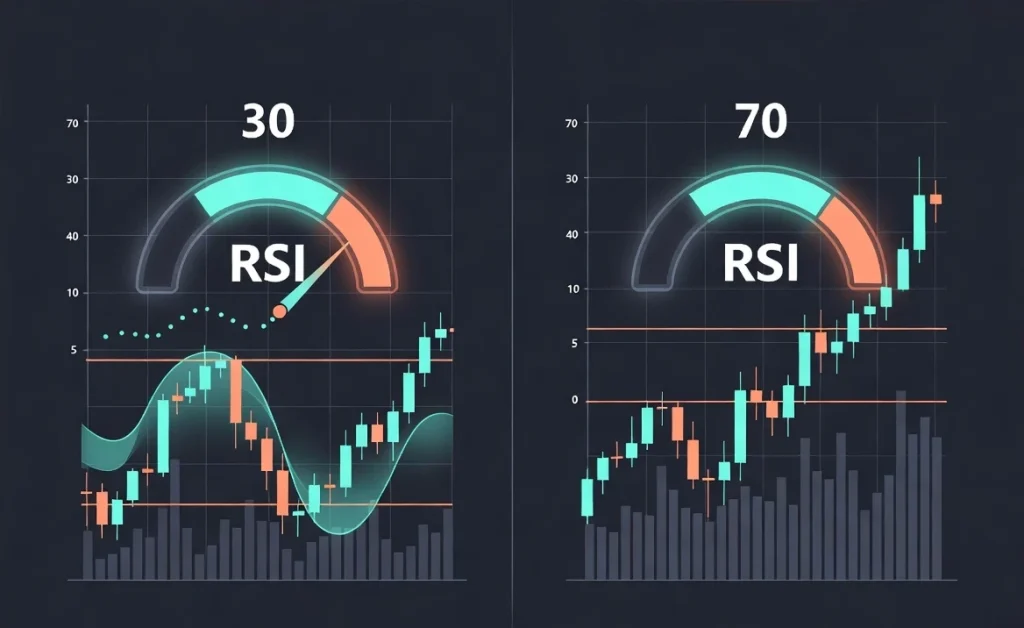
In range-bound markets, RSI above 70 may signal exhaustion near resistance, while RSI below 30 may signal exhaustion near support. Momentum tends to reverse more frequently because the market behaves more like a stretched rubber band that snaps back toward equilibrium.
However, confirmation still matters. Professional traders rarely enter positions based solely on RSI readings. They’re a lot more likely to combine RSI with support and resistance, candlestick structure, volume confirmation, and broader market context.
RSI can indicate a direction for you to investigate, but you need other factors to confirm your hunches.
The Problem With RSI Divergence
It’s easy to misunderstand divergence as it relates to RSI. Bullish divergence occurs when price makes lower lows while RSI forms higher lows. Bearish divergence occurs when price makes higher highs while RSI creates lower highs.
Many traders assume divergence is a definite indicator of an immediate reversal. Sadly, nothing is certain in market trading, which is where experience and expertise come into play. Divergence does signal weakening momentum. Trends can persist even while divergence develops in the background.
Confirmation is king in this situation. Weakening momentum is not enough to justify entering a reversal trade against strong market structure.
RSI Should Be a Context Tool
Lacking strong analysis skills, a lot of traders approach RSI. They treat it like a signal generator when it should really function as a context indicator. RSI helps traders understand momentum strength, trend conviction, exhaustion risk, and relative buying or selling pressure.
That is very different from using it mechanically.
It’s not just about whether RSI is overbought or oversold. Ask yourself what RSI is saying about momentum relative to the current market structure. That’s how you can extract actionable insights.
If RSI reaches oversold conditions directly into strong support while bullish rejection candles appear, the setup becomes more meaningful. If RSI reaches overbought levels near resistance while momentum weakens and volume fades, reversal probability increases.
The indicator alone cannot provide this context. Always consider price action first.
| Market Condition | Typical RSI Behaviour | Common Trader Mistake | Better RSI Approach |
| Strong Uptrend | RSI stays above 50 and frequently reaches 70+ | Shorting every overbought signal | Use pullbacks for continuation entries |
| Strong Downtrend | RSI remains below 60 and repeatedly hits 30 | Buying every oversold reading | Wait for structure confirmation first |
| Range-Bound Market | RSI oscillates between 30 and 70 | Entering without support or resistance context | Trade reversals near key range levels |
| High Volatility Session | RSI moves rapidly between extremes | Overreacting to short-term momentum spikes | Focus on higher timeframe confirmation |
| Low Timeframe Trading | Frequent false overbought and oversold signals | Overtrading and emotional entries | Use RSI with broader trend direction |
| Divergence Setup | RSI and price move differently | Entering reversals too early | Wait for price structure confirmation |
| News-Driven Market | RSI becomes unstable during fast moves | Trusting RSI blindly during macro events | Reduce position size and wait for stability |
| Trend Continuation Pullback | RSI retraces toward 40–50 zone | Assuming momentum is weakening | Treat pullbacks as possible continuation setups |
Use this table as a more detailed guide to reading RSIs. We’ve listed the common misinterpretations and what you should do instead.
Why Timeframes Matter
Timeframe selection is another source of confusion when it comes to RSI. Lower time-frames in the range of 1-, 3-, or 5-minute charts create excessive noise and generate constant overbought or oversold signals that mean very little.
These short intervals translate to small fluctuations continuously pushing RSI into extreme territory, causing traders to overreact to meaningless momentum changes. Higher timeframe RSI usually produces cleaner signals because it reflects stronger market intent and filters out short-term noise.
Many experienced traders focus on:
- 1-hour charts for short-term structure
- 4-hour charts for broader momentum
- Daily charts for overall trend direction
You can still use lower timeframes to help refine entries, but always include broader trend context in your decision-making process.
Emotional Trading Destroys RSI Strategies
The biggest RSI problem is often psychological rather than technical. Traders become emotionally attached to indicator readings and panic during extreme conditions because they assume a reversal is guaranteed.
This creates FOMO trades, revenge trading, early entries, poor exits, and weak risk management. Indicators are not a crystal ball that predicts the future. They’re sources of information that you have to interpret and take into account when making a decision.
Patience matters far more than reacting quickly to every RSI fluctuation.
Experienced traders rarely rely on RSI alone. Instead, they combine trend analysis, price action, volume, market structure, liquidity zones, and disciplined risk management. RSI becomes one piece of the puzzle rather than the entire strategy.
Traders using Insipix often improve consistency once they stop relying on RSI in isolation and start combining momentum readings with broader market behaviour and price structure analysis.
Final Thoughts
Most RSI strategies fail because traders misunderstand what the indicator actually measures. RSI does not predict reversals automatically. Overbought conditions do not guarantee selling pressure, and oversold readings do not guarantee bullish reversals.
Momentum, structure, and trend context always matter more than the number alone.
The traders who succeed with RSI stop treating it like a shortcut. They use it as a supporting tool alongside price action, trend analysis, and market structure. Once traders stop reacting blindly to overbought and oversold levels, RSI becomes far more useful and shifts from being a source of confusion to becoming a clearer way to understand market momentum, conviction, and potential exhaustion.